Automatic change context
Theme publishes, app and backend activity, and supported schema or platform events become investigation leads.
FunnelSleuth connects conversion performance with storefront changes, campaigns, inventory, merchant context, and platform incidents—then gives you a ranked, plain-English diagnosis of what to investigate first.
What happened
The decline is concentrated in the final funnel stage. A theme publish overlaps the start of the drop, making checkout QA the highest-value first step.
Start here: test checkout and review the July 26 theme publish.
Switch between conversion rate, orders, sessions, and revenue. Shopify and backend changes appear as purple markers; your own campaign, promotion, outage, and operational notes appear in amber.
FunnelSleuth · Store performance timeline
Illustrative data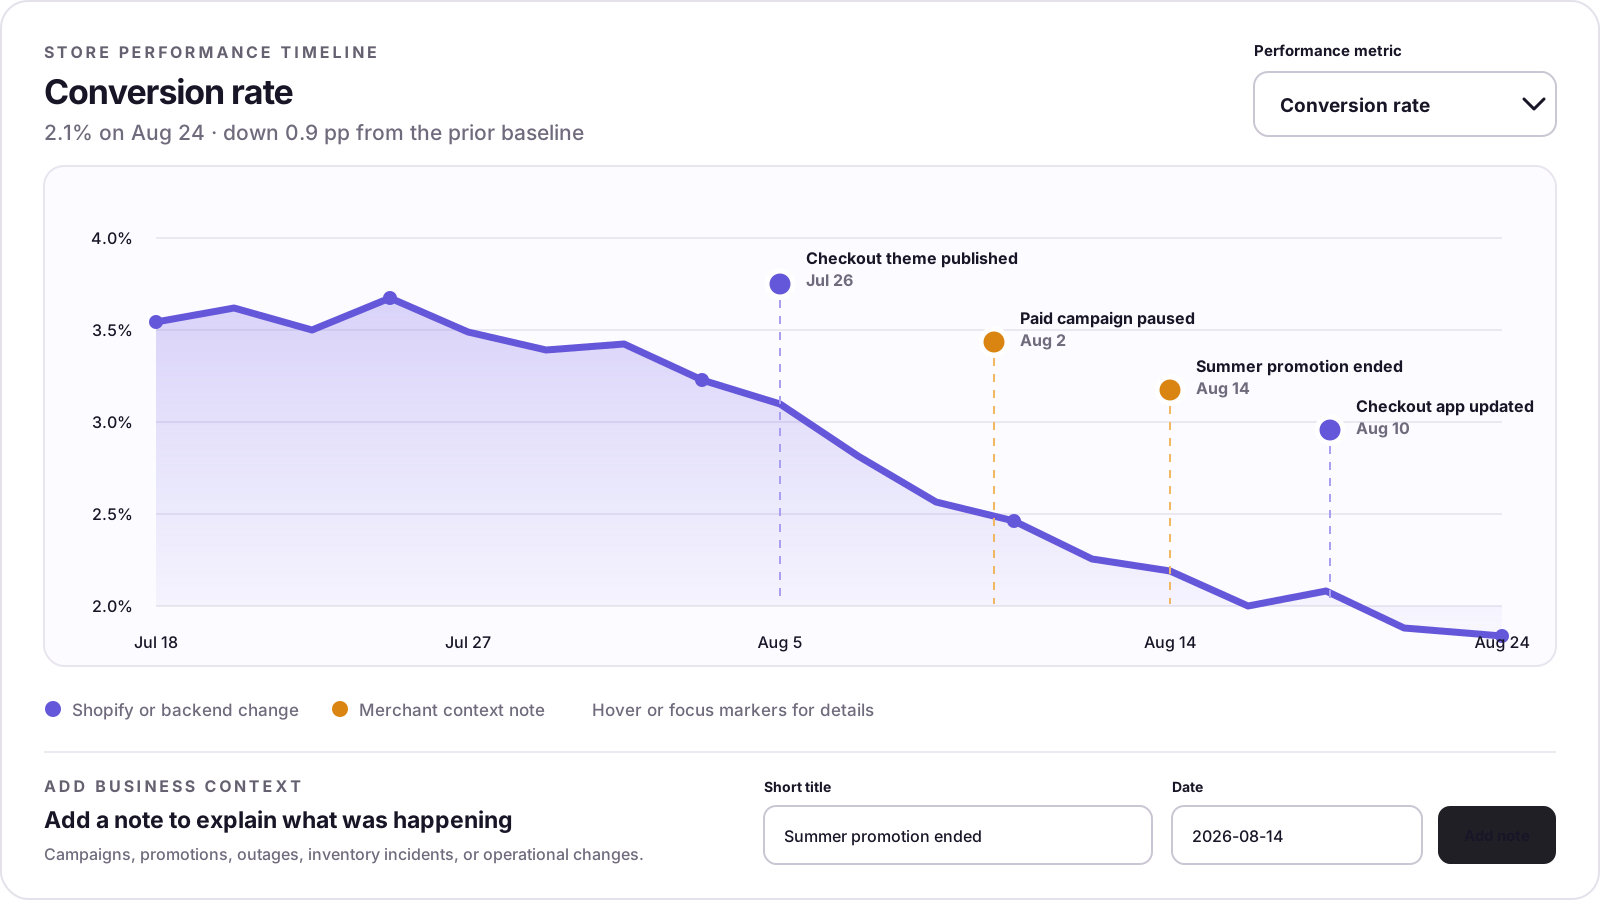
Theme publishes, app and backend activity, and supported schema or platform events become investigation leads.
Add promotions, campaign pauses, stockouts, cookie-banner changes, or anything Shopify cannot know on its own.
Surface relevant Shopify and enabled app-provider incidents so teams do not misdiagnose a third-party outage as a store regression.
FunnelSleuth starts with what changed, the most credible explanation, the estimated business impact, and the first action to take. Technical detail stays available without turning the opening screen into a data dump.
Evidence checked Small and statistically weak movements are de-emphasized.
Built for the moment when every team has a theory and nobody has an answer.
Find the exact stage that weakened—from product view and add-to-cart through checkout completion.
Layer theme publishes, app activity, campaigns, promotions, inventory context, and platform incidents onto performance.
Separate traffic mix from on-site performance and prioritize drivers by impact, confidence, orders, and revenue at risk.
Turn the evidence into a focused QA plan instead of changing campaigns, themes, and checkout settings all at once.
Explore the complete workflow with demo data, then connect live store analysis with a 60-day free trial. Continue for $29.99 USD per month.
Monthly plan
$29.99 USD / month
Get the clearest next step before your next rollback, redesign, or campaign change.